Ultimate guide to remote debugging web pages on Android & iOS across browsers
As the number of mobile users is increasing, it is of high importance to provide mobile-friendly pages. Remote debugging web pages is a method with which they can be debugged in PCs or laptops as mobile user-agents, so developers can better find user interface (UI) and user experience (UX) issues that exist for mobile users. In this article, we will talk about how to do remote debugging with different mobile devices and browsers in order to see how our website pages perform on mobile devices.
In this article, you will read about:
Why do you need to debug web pages on mobile phone displays?
As the number of mobile users who prefer using a mobile phone for web surfing is increasing, it is really important to consider mobile-friendliness, which is also a critical ranking signal, to provide better user experience. It is possible to check mobile-friendliness of web pages using browsers’ mobile simulators, but testing on real mobile devices may uncover some issues that we may not be able to detect through browsers’ mobile simulators. In this case, remote debugging pages is an effective solution that helps us to find mobile-friendliness problems, and then take necessary actions.
Remote debugging using a physical mobile device
Remote debugging, which is considered as an advanced debugging solution, is a web page debugging method using a physical mobile or tablet device. The remote debugging instructions for Android and iOS devices and Google Chrome, Safari, and Firefox browsers are explained in this article.
Remote debugging using Google Chrome on Android devices with Windows
You can do remote debugging using an Android phone or tablet and Google Chrome browser on Windows and macOS with the same steps in all mentioned operating systems. To do so, first you need to make some preparations, then you can debug pages.
Step 1: Enabling Developer Options and connecting Android device:
- On your Android device, enable Developer Options.
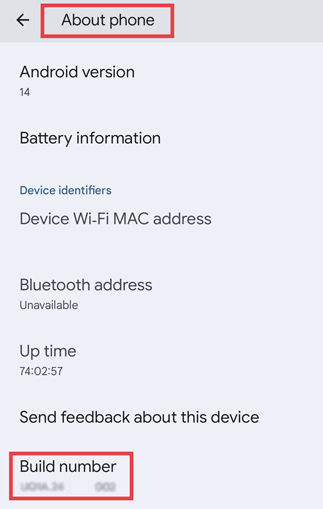
- Head over to the Android device Settings > About phone.
- Find the Build Number based on your phone’s model there.
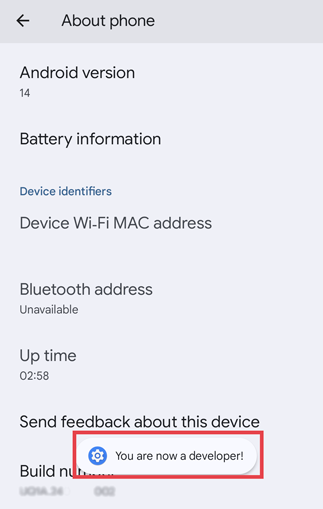
- Tap 7 times on the build number to see the “You are now a developer!” message
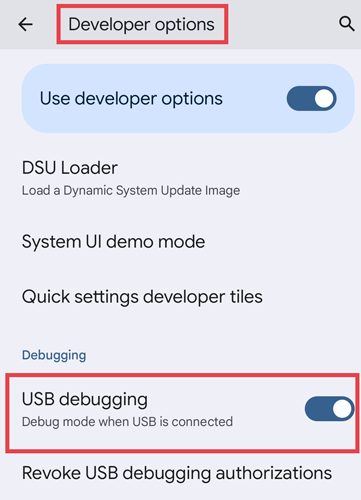
2. In Developer Options, select Enable USB Debugging.
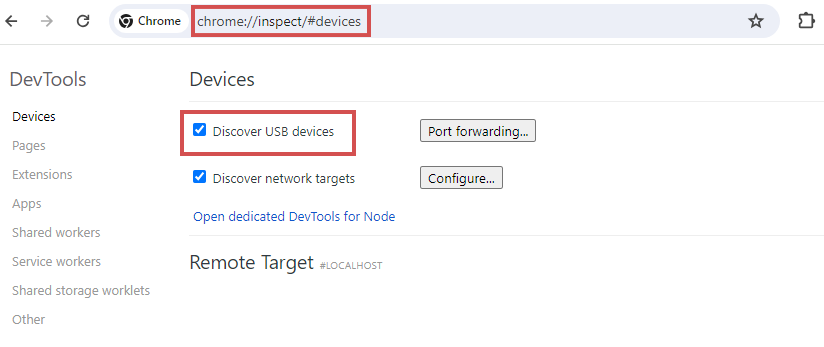
3. On your laptop, PC, or every other machine where you are going to debug, open chrome://inspect#devices on your Google Chrome browser.
4. Enable Discover USB devices.
5. Connect your Android device to the PC or laptop with a USB cable.
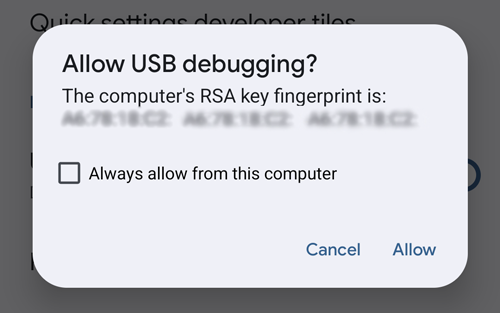
6. For the first-time connection, you need to accept the prompt on your phone to authenticate the connection. After seeing your device model number on Google Chrome, it means the connection between your Android device and DevTools has been successfully established.
Step 2: Starting remote debugging
- Open Chrome browser on your Android device.
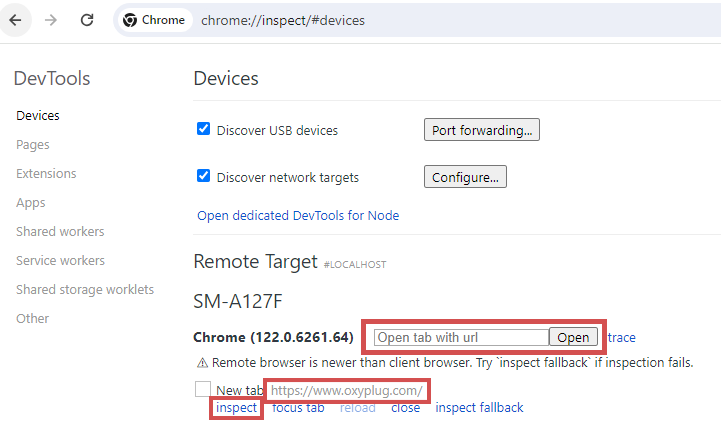
- At the same time, in the Open tab with url box on your computer, enter a URL and open it. The URL will be opened in a new tab on your Android device (You can also first open a page on your Android device Chrome browser).
- Click on the Inspect under the URL you want to debug on your PC or laptop to start debugging.
Troubleshooting:
In the case of not being able to make the connection between an Android device and a computer:
- Make sure the USB cable works well.
- Try to connect and disconnect the USB cable.
- Try to connect the device directly to the computer instead of using USB hubs.
- If your computer does not recognize your mobile device, try to install Android USB drivers. You can find the instructions here.
- Make sure your phone is not in charging mode.
- If you do not receive the Allow USB Debugging prompt on your Android device, try to keep your device unlocked. Additionally, change the sleep mode settings on both devices, Android and PC (or laptop). So, they will never go to sleep mode. You can enable the Stay awake option in your phone’s Developer options
- In the Developer Options section on your Android device, reset USB debugging settings by selecting Revoke USB Debugging Authorizations.

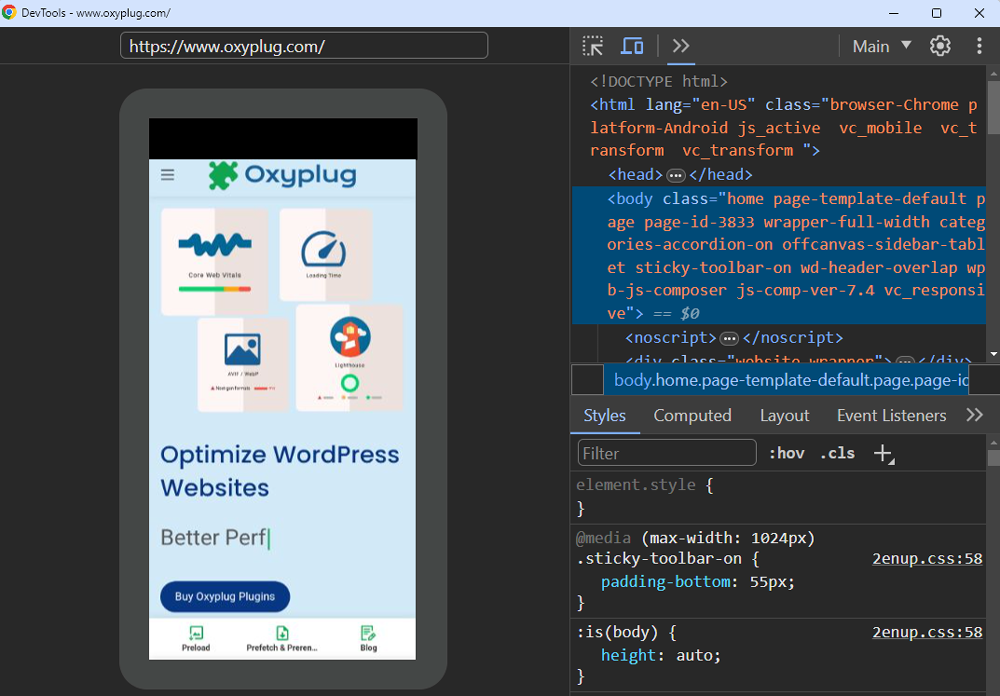
The version of your Google Chrome on the Android device specifies the DevTools look that you see on your laptop or PC. So, if the Chrome browser version is too old, the DevTools will look different
In chrome://inspect/#devices, you can see your Android device model and the Google Chrome version of the phone or tablet.
Remote debugging using Google Chrome on iOS devices with macOS
From Google Chrome 115, it is possible to do remote debugging with an iOS device and a Google Chrome browser application on a Mac.
Before starting, make sure about iOS device:
- iOS version: 16.4 or greater
- Chrome version: 115 or greater
To start remote debugging, you need to enable Develop in Safari on your Mac from Safari application settings > Advanced settings.
On your iOS device:
- Open Google Chrome application.
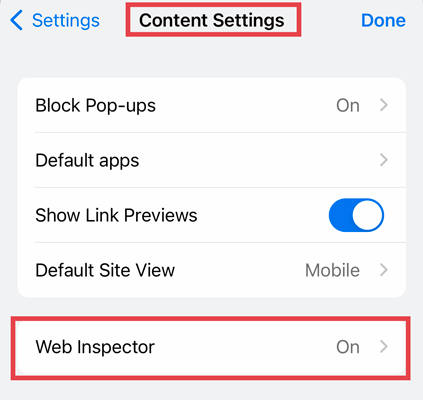
- Navigate to the Settings section in the app.
- In the Content Settings, enable Web Inspector.
- Close the app and relaunch it to apply changes.
Start remote debugging:
- Connect your iOS device to your Mac using a cable.
- In the Chrome app, open a web page that you want to debug.
- In Safari on your Mac, head over to the Develop menu.
- Hover on your iOS device name, then select the URL that is going to be inspected.
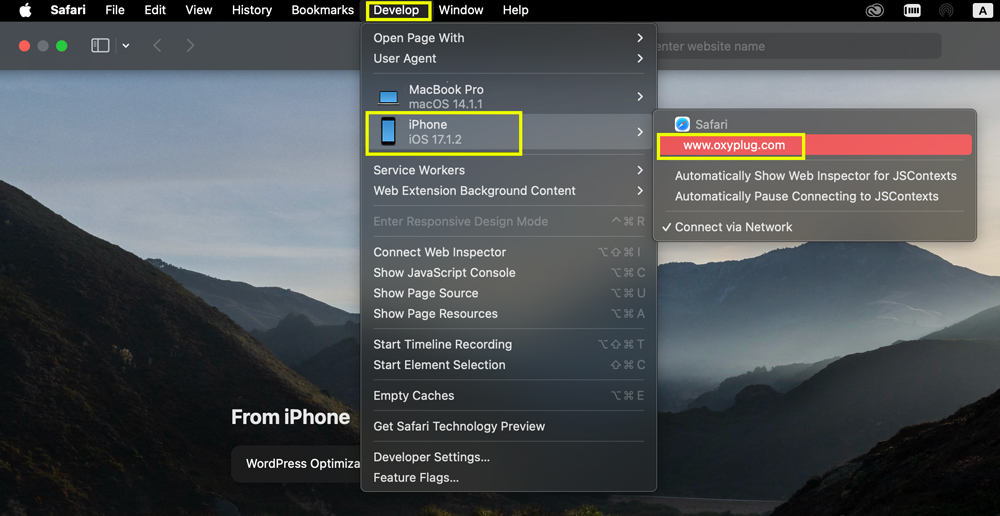
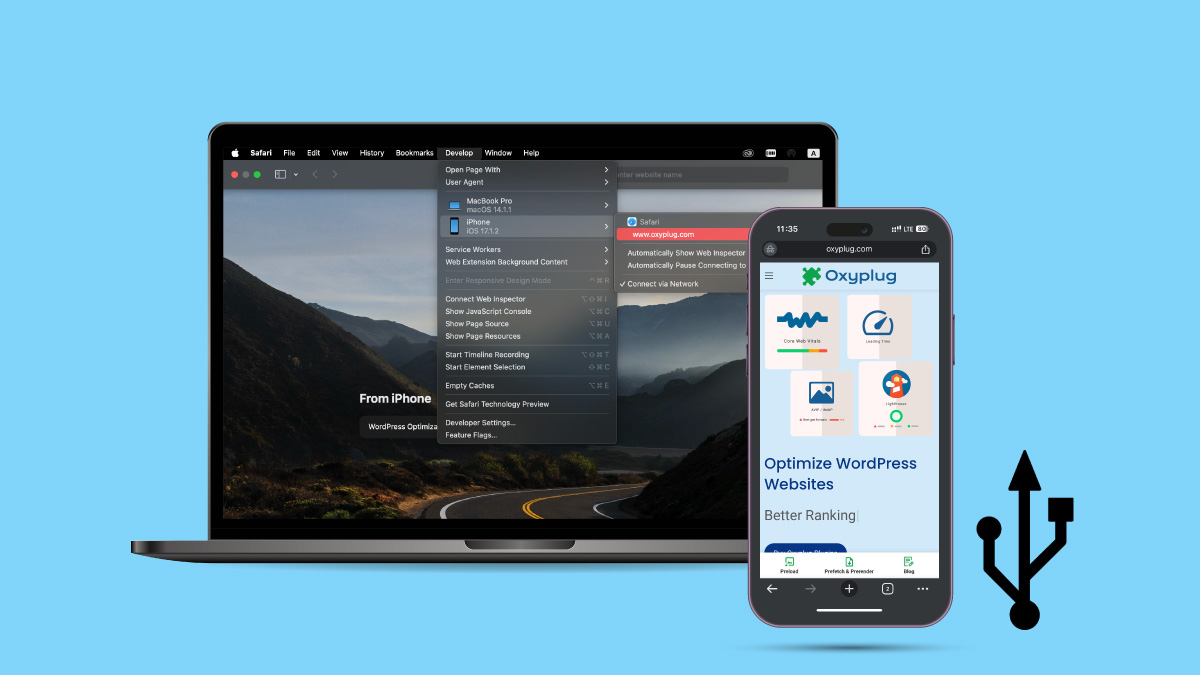
In the opened Web Inspector, you will be able to inspect the desired page with a mobile view in Safari browser on your Mac.
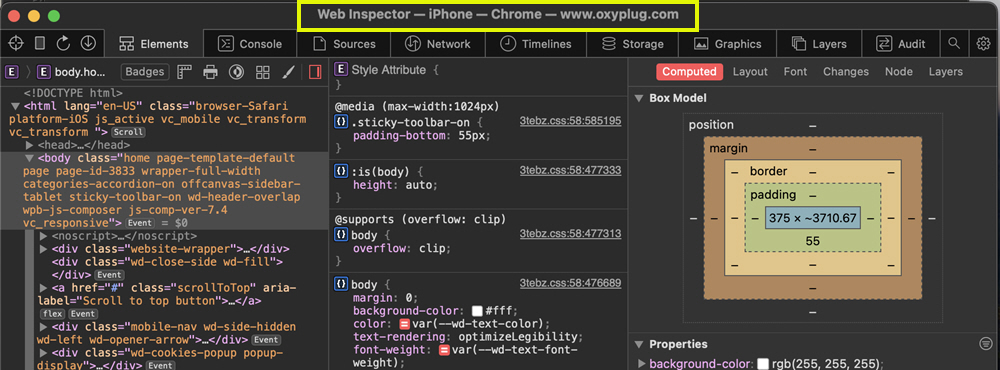
Unlike Google Chrome, the mobile device frame is not shown in Safari remote debugging.
Remote debugging using Safari on iOS devices with macOS
It is also possible to do remote debugging on an iOS device using Safari browser on both sides (iOS phone or tablet and Mac). The same as the previous method, you need to enable Develop in Safari on your Mac from Safari application settings > Advanced settings. Then:
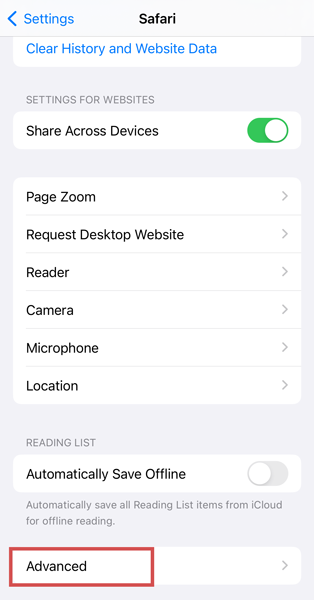
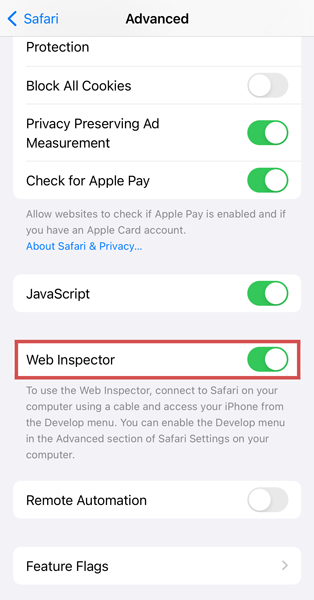
- On your iOS device, head over to Settings > Safari app.
- Find Advanced at the end and tap on it.
- Enable Web Inspector.
- Connect your iOS device with a cable to your Mac.
- Open Safari on your iOS device and enter a URL that you want to debug.
- On your Mac, open Safari and head over to the Develop menu.
- Click on your iOS device name, and then on the URL that is open on the iOS device.
Remote debugging using Firefox on Android devices with Windows
You can also debug web pages using Firefox browser and an Android device on Windows. To do so, you can follow the instructions below:
Enabling Developer Options and remote debugging in Android device:
- Head over to the Settings > About Phone.
- Find your device’s Build Number.
- To enable Developer Options, tap 7 times on the build number until the “You are now a developer!” message appears.
- In Developer Options, Enable USB Debugging.
Start remote debugging on an Android device through Firefox browser:
- Open about:debugging in Firefox browser on your PC or laptop.
- Press on the Enable USB Devices button to be able to do remote debugging.
- Connect your Android device to the computer using a USB cable.
- On your Android device, open the Firefox app and open the page address where you want to debug.
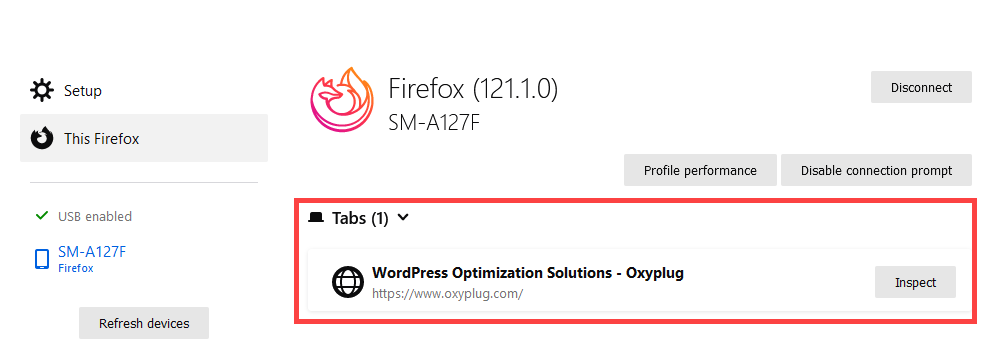
- On your PC or laptop, about:debugging page, click on your Android device name to connect to the device.
- From the tab list, find the page that you are going to debug and click on the Inspect button.
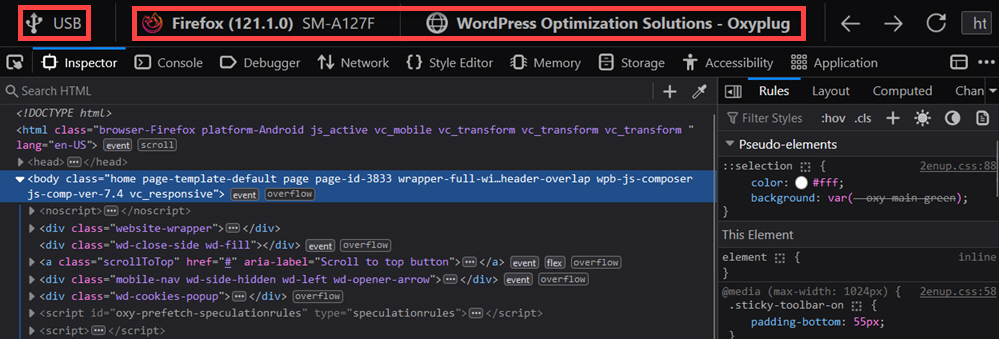
If the version of the Firefox browser is older than the current version of your computer, an update required message warning will be popped up.
Unlike Google Chrome, the mobile device frame is not shown in Firefox remote debugging.
Mobile device simulator in browsers
As mentioned earlier, another way to debug a page from a mobile view is to use the browsers’ mobile simulation feature. In most modern browsers such as Google Chrome, it is possible to inspect a page with different mobile phones or tablets by following the steps below:
- Open Google Chrome DevTools using Control+Shift+C or F12 on Windows and Chrome OS, or Command+Option+C on macOS.
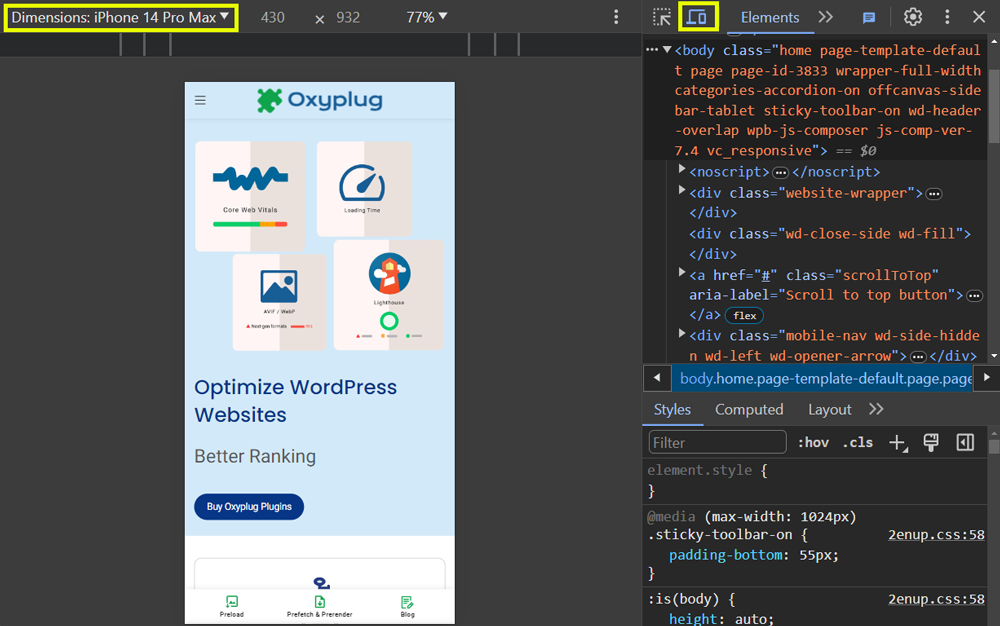
- On the top left side, click on the Toggle device toolbar icon or press Ctrl + Shift + M.
- Change the device type or model from the Dimensions dropdown.
Conclusion
Remote debugging is a practical method with which you are able to debug web pages on Android or iOS devices on a computer. This solution helps developers find technical and design-related issues like page responsiveness, so by solving them, they can provide users with a better mobile experience.