What is INP and how to optimize it?
Providing a good user experience is among the highest website priorities which needs to be considered by website owners and webmasters in a precise way as much as possible. User experience involves different aspects and one of the most important aspects is the response time to the user interactions. The less time to respond to the user requests, the better user experience a user has. Interaction to Next Paint (INP) is a metric with which we can become aware of user interaction responsiveness conditions on our websites and improve the user experience. In this article, we will read more about Interaction to Next Paint (INP) and learn how we can improve the INP score.
In this article, you will read about:
- What is Interaction to Next Paint (INP) and how is it calculated?
- What is the goal of INP?
- What is a good Interaction to Next Paint (INP) score?
- What is the difference between INP and FID?
- How to measure Interaction to Next Paint?
- How to find the interaction that causes a long INP score?
- How to find and fix long input delay as the first phase of an interaction?
- How to optimize event callbacks as the second phase of an interaction?
- How to minimize presentation delay as the last phase of the interaction?
What is Interaction to Next Paint (INP) and how is it calculated?
Interaction to Next Paint is a metric which measures the time that is spent to respond to a user interaction and show the next paint. In fact, INP measures all the possible interactions on a page that a user can have such as clicking, typing, and tapping and considers the longest one as the result.
INP is calculated by measuring all the page’s interactions, then a percentile of all the interactions is considered as the value.

A percentile is a value that precedes the same value in the population as a percentage.
What is the goal of INP?
An interaction consists of some events that happen from the same user side. To explain more, when you tap on a device’s screen, there are three events which happen by tapping on the screen: pointerup, pointerdown, and click.
The Interaction to Next Paint aim is to help webmasters find solutions for providing the shortest time possible during the period a user starts the interaction with a page until the next paint is shown to him.
Hovering and scrolling down or up are not considered as interactions, but scrolling a page using a keyboard can be counted by INP as an interaction.
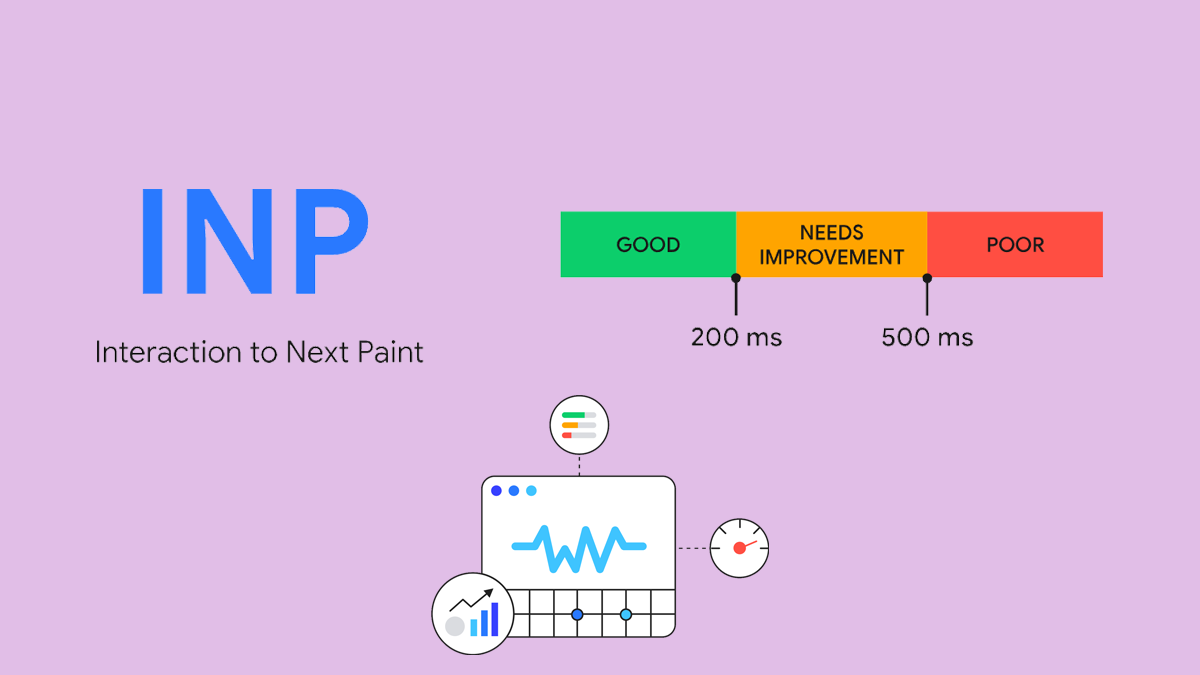
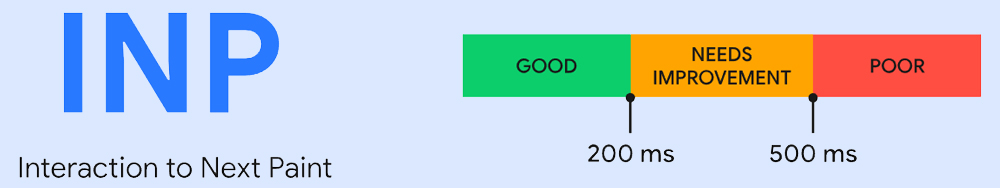
What is a good Interaction to Next Paint (INP) score?
Deciding about whether a page’s INP score is good or not, is difficult due to the variety of elements which must be considered on a page and from user side, but here are general estimations about a page’s responsiveness scores:
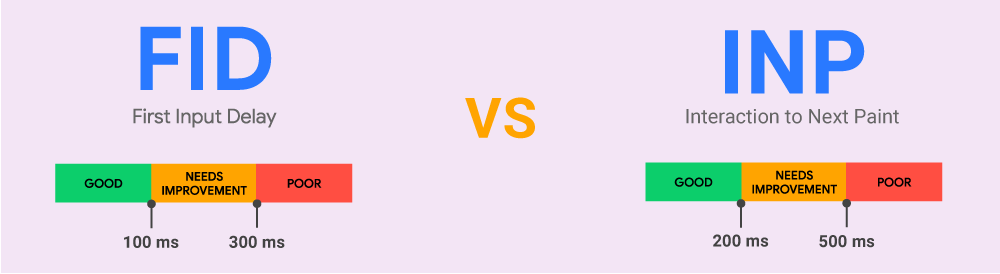
- Good: If a page’s INP is below or equal to 200 milliseconds, it means your page’s responsiveness is good.
- Needs improvements: If the page’s INP is more than 200 ms and less than 500 ms, it means the page’s responsiveness needs improvements.
- Poor: If the page’s INP is more than 500 ms, it means the page’s responsiveness is poor.
In the video below, you can see a comparison between good and poor INP:
What is the difference between INP and FID?
In fact, the Fist Input Delay (FID) measures the first interaction’s input delay on a page and if this interaction has very little to no delay, it will provide a good user experience at first. This is while the Interaction to Next Paint (INP) measures all interactions and the latency for showing the next paint on a page. This responsiveness metric is more precise than FID, because it can provide a more reliable result about a page’s responsiveness by considering and measuring all the interactions of a page, not just the first interaction exclusively.
How to measure Interaction to Next Paint?
For measuring the INP score, there are several tools which you can try to see a page’s INP score. In this article, you can find all possible methods, but we have chosen the simplest ones which can be easily used by all users:
- Field tools
- Lab tools
- Lighthouse in DevTools, timespan mode.
- Lighthouse npm module
- Lighthouse User Flows
- Web Vitals extension for Chrome
- Measuring INP score in JavaScript
How to find the interaction that causes a long INP score?
To improve the interaction to the next paint score, we need to find out which interaction on a page causes the higher INP score (poor score) and longest responsiveness time at first. For finding the slow interaction, there are different methods (field tools and lab tools) which have been mentioned earlier. By using one of the solutions above, it is possible to find the interaction which causes the slowness and results in a poor INP score.
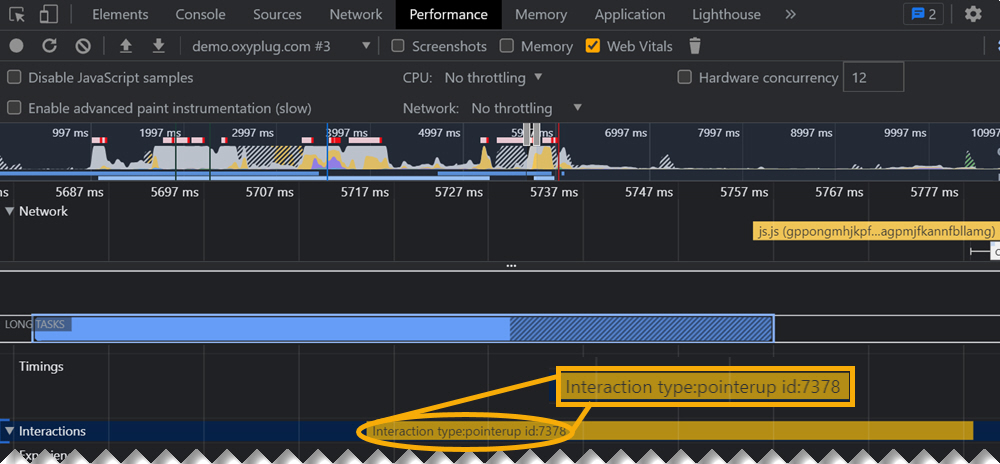
Using DevTools performance tab
To find the interaction which causes long responsiveness time, using the performance option in DevTools is an easy solution. You can follow the steps below:
- Open Google Chrome DevTools by pressing F12 in Windows (Fn + F12 in Mac) or Ctrl + Shift + C in Windows (Cmd + Option + C in Mac) or doing a right click and selecting Inspect.
- Head over the Performance tab.
- Click on the record button on the left corner above the DevTools window (you can also press Ctrl + E to start recording).
- Do an interaction (tap, click, or type).
- Click on the record button again to stop the recording.
Once it is done, you can see the interaction’s details and what has happened while making the interaction in the performance profiler, above the main thread.
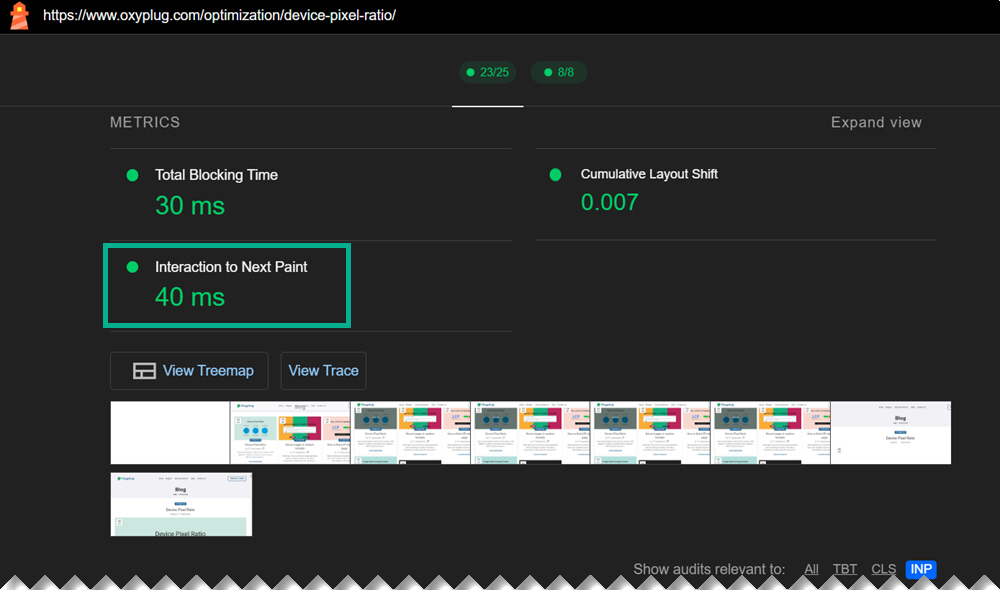
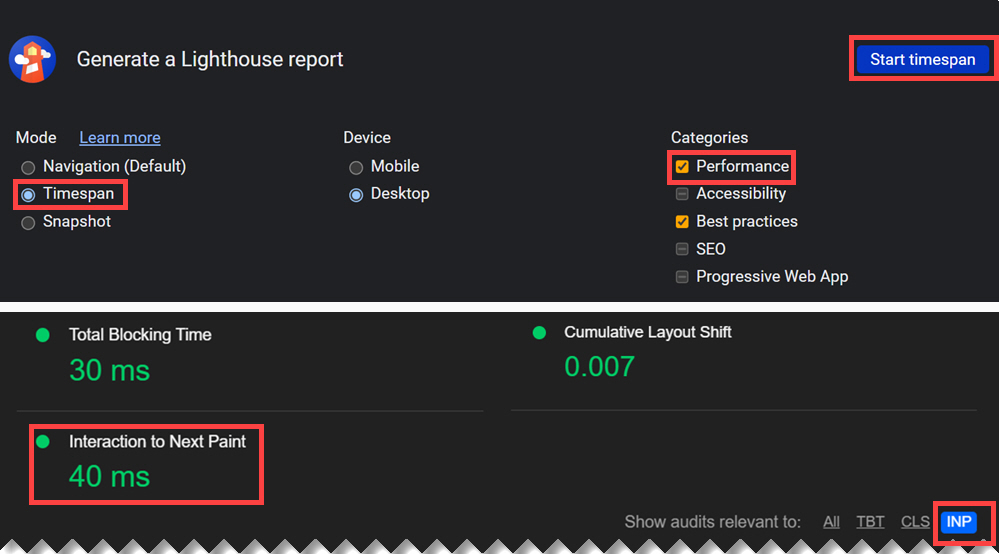
Using DevTools Lighthouse with timespan mode
Lighthouse timespan mode is another method for finding the interaction causing the long latency and high INP score. To work with this feature, you can follow the steps below:
- Open Google Chrome DevTools by pressing F12 in Windows (Fn + F12 in Mac) or Ctrl + Shift + C in Windows (Cmd + Option + C in Mac) or doing a right click and selecting Inspect.
- Go to the Lighthouse tab.
- Choose Timespan under the Mode section.
- Select the device you prefer.
- Select Performance under the Categories section if it has not been selected.
- Click on the Start timespan.
- Make an interaction like click, type, or tap.
- Click on the End timespan.
Once it is done, the lighthouse result will be generated and you can filter the INP form the Show audits relevant to in order to see the details about INP and the interactions which are passed or failed.
Using web vitals JavaScript library
One other way to find the interaction that causes high INP score is to use web-vitals JavaScript library.
By using the code below, you will be able to see the INP score in your browser’s console easily:
<script>
  ((function() {
      var script = document.createElement('script');
      script.src = 'https://unpkg.com/web-vitals@3/dist/web-vitals.iife.js';
      script.onload = function() {
        When loading `web-vitals`
        using a classic script, all the public methods can be found on the `webVitals`
        global namespace.webVitals.onCLS(console.log);
        webVitals.onFID(console.log);
        webVitals.onLCP(console.log);
        const report = ({
          name,
          value,
          attribution
        }) => {
          console.log(name);
          console.log(value);
          console.log(attribution.eventType);
          console.log(attribution.eventTarget);
        };
        webVitals.onINP(report);
      };
      webVitals.onINP(report);
    }; document.head.appendChild(script);
  })();
</script>
You can use the script above in a simple way by following the steps ahead:
- Copy and paste the script on a page you are going to test.
- Open the page containing the script
- Open the Google Chrome Console by pressing Ctrl + Shift + J in Windows or Linux or Cmd + Option + J in Mac
- Press Ctrl + Shift + R in Windows and Linux or Cmd + Shift + R in Mac to hard reload the page without cache and load the js again.
- Wait for some seconds to see the INP result in the console
Some other ways to find slow interactions on your website
There are some other ways to find the interactions which cause the slowness on a page. These methods are helpful in the case you are going to check some common activities such as add to cart or searching on your website.
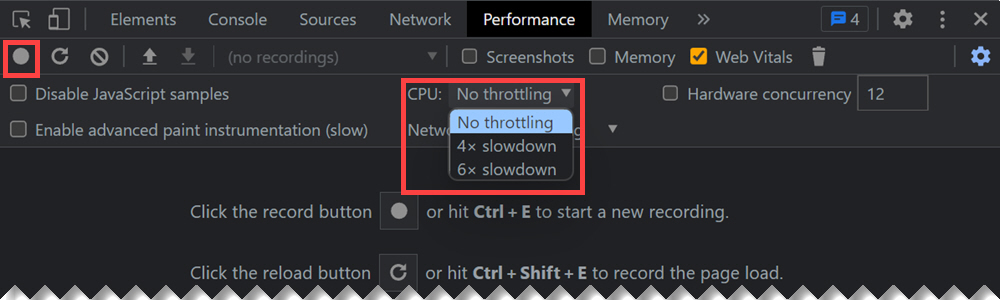
Throttle CPU
The first way is to record a page using the performance tab in Google Chrome DevTools. Before starting recording the page, change the CPU throttling to 4x or 6x slowdown. This makes your computer’s CPU perform 4 or 6 times slower to return the right interaction speed on the slow-end devices.
To enable CPU throttling feature and record the page performance, follow the steps below:
- Open Google Chrome DevTools by pressing F12 in Windows (Fn + F12 in Mac) or Ctrl + Shift + C in Windows (Cmd + Option + C in Mac) or doing a right click and selecting Inspect.
- Head over to the Performance tab.
- Choose the 4x slowdown (or 6x slowdown) from the CPU dropdown.
- Click on the recording button ⏺️ or press Ctrl + E to start recording.
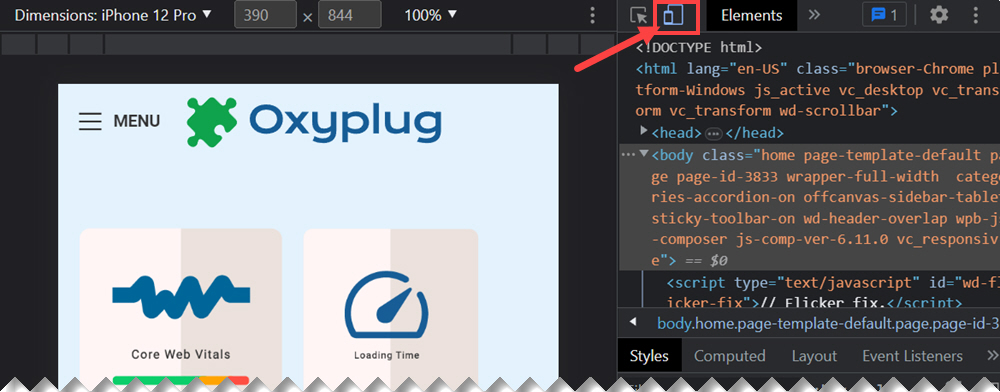
Enable mobile emulation
Another way for finding the slow interaction on a page, is to emulate a mobile device on the desktop and choose a low-end device. The way that the page is served will get affected after changing the user agent to mobile device.
For enabling the mobile emulation feature in Google Chrome DevTools, you can follow the steps below:
- Open DevTools by inspecting an element on the page (do a right click and press Inspect) or pressing F12 (or Ctrl + Shift + J) in Windows or Linux and Cmd + Option + J (or Fn + F12) in Mac OS.
- Click on the Toggle device toolbar icon on the top left.
If you cannot find a low-end device in the devices list on Google Chrome DevTools, you can easily add different mobile devices to the Google Chrome DevTools (predefined or custom devices).
Remote debugging
One more method to find the slow interactions on a page is remote debugging on your Google Chrome. To do a remote debugging, first you need a physical low-end mobile device, then by continuing the steps provided below, you can do the remote debugging in order to see which interaction causes the slow INP on an old or low-end device:
- Open Google Chrome on the desktop
- Go to the chrome://inspect/#devices
- Make sure the Discover USB devices is enabled
- Connect your phone using a USB cable to the PC
NB: If it is the first time you are using the remote debugging feature, you need to accept the debugging message prompt. - See the device model name to make sure your device is connected successfully to the Chrome DevTools.
- Open Google Chrome on your android device.
- On your PC, in the chrome://inspect/#devices, enter an address in the Open tab with url box and open it. The URL will be opened on a new tab on your mobile device.
- Interact with the opened tab on your mobile device through your PC to find the slow interaction of the page.
How to find and fix long input delay as the first phase of an interaction?
Input delay, as the first phase of an interaction, is the period of time from when a user interacts with a page (an input is received from the user) until the browser processes the event which is triggered by the input. Input delay can be easily found through the Google Chrome DevTools Performance tab, in the interaction panel. For finding the input delay period, you can consider the start of the interaction as the beginning of the input delay and start of the event callbacks as the end of the input delay.
It is highly important to control the input delay as much as possible. One way to take control of the first phase of the interaction, is to find out if other works are getting done on the main thread which prevent the event callbacks from happening.
To fix the long input delay which is caused by your first-party work:
- Do little work in any task your code kicks off
- Break up long tasks
- Prioritize the critical tasks and defer non-critical ones by using the Scheduler API
- Use isInputPending if the user input is pending.
If there are third-party works which are causing the long input delay and slow interactions as a result, there are other things to be considered in order to fix the long delay:
- Make a list of all third-scripts on your website
- Find out if there are scripts whose functionality overlaps with other third-party scripts.
- Remove unnecessary or low-value third-party scripts.
How to optimize event callbacks as the second phase of an interaction?
Event callbacks, as the second phase of an interaction, are the actions which run as a response to the user interaction and they must run as fast as possible.
The way to see the event callbacks run fast is to limit the main action which is necessary for the next frame to be shown, to run and the other actions can be deferred as a subsequent task.
How to minimize presentation delay as the last phase of the interaction?
The presentation delay is the last phase of an interaction which starts after the event callbacks end. This part is the only part which we do not have enough control on it, but there are some things to consider in this phase:
- Be conscious about async and await attributes, because you may imagine that these two attributes do not block rendering, but it is completely possible that even an async function which breaks a work in callback into another, still blocks rendering due to the browser decision for running it before the next frame.
- Do not use requestAnimationFrame() for the works which do not include rendering, because they must run and be completed before the next frame presentation, and when you use this function for the works which are not related to the rendering, you can cause delaying the next frame.
- Be careful about the callbacks which run with high priority to render. If the work they are going to do is heavy, they may cause the presentation delay.
Solutions for interactions overlaps
Sometimes there are some interactions which overlap. It means that if there are some interactions within a short period of time, they may overlap with each other. To explain more, the presentation delay of an interaction is the cause of long input delay of the next interaction.
The key points for controlling the overlaps and interactions slowness are doing little work in event callbacks and keeping the tasks as short as possible.
Conclusion
Interaction to Next Paint is a useful metric for measuring a page’s responsiveness to the user interaction. The smaller the INP score is, the better the page’s responsiveness! Keeping the INP score small needs lots of effort and work and it is certainly permanent work. You always need to be aware of your website’s condition and control everything which may cause poor interaction and result in a slow page experience for your website users.